
The average Shropshire home fell 1.3% in the year to July, to £275,232, the first annual fall since 2024. Telford, Herefordshire and Powys all rose.
The average home in Shropshire was worth £275,232 in July 2026. That is £3,494 less than in July 2025, a fall of 1.3%, and the county’s first year-on-year fall since August 2024.
Shropshire’s neighbouring councils mostly went the other way. Telford and Wrekin rose 3.2%, Herefordshire 1.8% and Powys 3.8%.
The figures come from the UK House Price Index for July 2026, which HM Land Registry published on 16 September. England rose 1.1% over the same year and the West Midlands region 1.5%.
The index figure is a mean average, not a median. A few expensive sales pull it up, so it is not what a typical home on your street sold for. It is also a first estimate, and the Land Registry revises it as more sales are registered.
A sharp month, against a strong July last year
The July figure dropped £7,929 in a single month, from £283,161 in June. That 2.8% monthly fall is what turned a rising year into a falling one.
There is a reason to read it carefully. July 2025 was itself unusual. Prices jumped 2.9% in that one month, from £270,747 to £278,726. So this year’s July is being measured against a high point.
The recent run of monthly figures, as they stand in the July release:
| Month | Average price | Change on a year earlier |
|---|---|---|
| March 2026 | £277,462 | +0.5% |
| April 2026 | £282,167 | +3.3% |
| May 2026 | £279,970 | +2.8% |
| June 2026 | £283,161 | +4.6% |
| July 2026 | £275,232 | -1.3% |
June has already been revised. When it was first published in August, the June average was £284,036 and the annual rise 4.9%. It now stands at £283,161 and 4.6%.
Shropshire fell while its neighbours rose
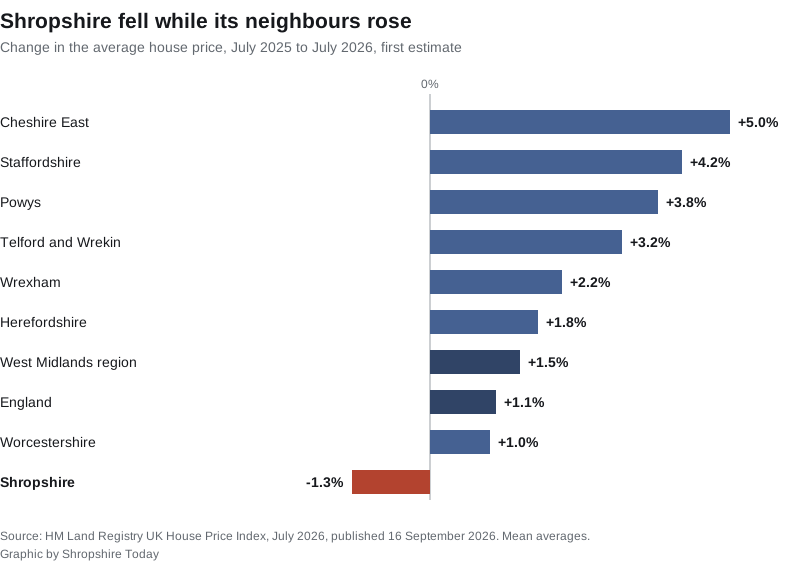
| Area | Average, July 2026 | Change on the year |
|---|---|---|
| Cheshire East | £309,121 | +5.0% |
| Staffordshire | £250,633 | +4.2% |
| Powys | £237,762 | +3.8% |
| Telford and Wrekin | £226,893 | +3.2% |
| Wrexham | £212,778 | +2.2% |
| Herefordshire | £289,607 | +1.8% |
| Worcestershire | £287,268 | +1.0% |
| Shropshire | £275,232 | -1.3% |
Shropshire homes still cost £48,339 more on average than homes in Telford and Wrekin. That gap was £58,972 a year ago.
Not every neighbour rose. Wyre Forest, which borders south-east Shropshire, fell 0.6%, although Worcestershire as a whole rose 1.0%.
Across the West Midlands region, only two council areas fell further than Shropshire. Rugby fell 3.5% and Redditch 1.9%. Across all 295 council areas in England, 85 recorded a fall, and Shropshire had the 53rd largest.
Flats fell hardest
Every property type was cheaper on average than a year earlier:
| Property type | July 2025 | July 2026 | Change |
|---|---|---|---|
| Detached | £419,971 | £413,721 | -1.5% |
| Semi-detached | £259,305 | £258,066 | -0.5% |
| Terraced | £207,701 | £206,094 | -0.8% |
| Flat or maisonette | £140,055 | £133,923 | -4.4% |
| First-time buyer average | £224,826 | £222,517 | -1.0% |
Semi-detached homes held their value best, down £1,239. Flats lost £6,132, the biggest fall in percentage terms.
Why one month should not be over-read
Shropshire’s index moves around. It is built from a few hundred sales a month across a large rural county. The Land Registry recorded 289 sales in May 2026, the latest month with a count, and sales take weeks to be registered.
That is why March 2026 showed a rise of only 0.5% and April 3.3%. A single month can swing on the mix of homes that happened to complete. The direction over the next two or three releases will say more than July alone.
What it means for you
- If you are buying, the average price is lower than a year ago for the first time since August 2024. For a first-time buyer the average is £222,517, down £2,309.
- If you are selling a flat, the average fell 4.4% over the year, much faster than houses.
- If you want the price for your own town, the index does not go below council level. Our Shropshire house prices page has the middle price actually paid in each town and ward, from Land Registry sale records.
- Before you rely on July, remember it is a first estimate. June was revised down within a month.
The August figures are due from HM Land Registry in October. For the jobs side of the county’s money picture, see our report on Shropshire’s claimant count in August.
Sources
- UK House Price Index for July 2026, HM Land Registry, published 16 September 2026
- UK HPI, Shropshire, July 2025 to July 2026
- UK HPI full file, July 2026, used for the neighbouring and regional comparisons, the England ranking, the monthly series and the May sales count
- About the UK House Price Index, HM Land Registry, on how the index is calculated and revised
Have your say